04 · AppsCode · Product Design
Cluster management
Once a cluster is connected, the real work starts inside it: finding what failed, reading logs, checking backups, rolling back a release. I designed and built the screens that make that work possible from the browser.
- Kubeconfigs needed on your machine
- 0Kubeconfigs needed on your machine
- Click to a pod’s logs or shell
- 1Click to a pod’s logs or shell
- Ways to read a security scan
- 4Ways to read a security scan
- Designer
- Mohin Uddin
- Role
- Product Design, Information Architecture, UI Engineering
- Timeline
- AppsCode · ongoing
- Technology
- Vue 3, Nuxt, Tailwind CSS v4, Figma, AppsCode Design System
- Shipped at AppsCodein production consoles
- Real screenssensitive values blurred
- Design and UI code by meAPIs by the engineering team
My role
- I own these screens end to end: how a cluster’s resources are organised, every list, detail page and state, and the Vue UI code behind them.
- Me, with 3–4 engineers who connect the APIs and data
- Ongoing, day by day, across my 7 years at AppsCode (opens in a new tab)
At a glance
- 01 · The problem
Inside a cluster, a simple question like “why is this failing?” took a chain of commands and a kubeconfig most of the team didn’t have.
Read the problem - 02 · The approach
A cluster has thousands of objects, so I designed for the question, not for the object model.
See the approach - 03 · The result
Day-to-day cluster work now happens in the browser, for everyone allowed to do it.
See the result
01 · Challenge
Inside a cluster, a simple question like “why is this failing?” took a chain of commands and a kubeconfig most of the team didn’t have.
- Finding a broken pod meant get, describe, logs and events, one command at a time, and remembering the namespace for each.
- Backups, Helm releases, monitoring and security reports each lived in a different tool, so nobody saw the whole state of one cluster.
- Only the people with cluster access could look, so everyone else waited for them.
BeforeWhy is this pod failing?
kubectl get pods -A | grep -v Running
kubectl describe pod sam-my-full-backup-… -n demo
kubectl logs sam-my-full-backup-… -n demo
kubectl get events -n demo \
  --field-selector involvedObject.name=…
kubectl exec -it … -n demo -- /bin/shAfterThe same answer, in the console
Workloads › Pods
  All namespaces · search
  sam-my-full-backup-…   0/1   ● Error
                         [ Logs ]  [ Terminal ]

Open the pod
Overview · Events · Graph · Manifest02 · Users
Three people open a cluster for three different reasons.
Developers
Check that their app is running, read its logs and fix what broke.
What got in the way Asking someone with cluster access to run a command for them.
SREs on call
Find the failing thing fast, follow it to its cause and recover.
What got in the way Jumping between the terminal, Grafana and Helm to rebuild one picture.
Platform admins
Keep backups, releases, monitoring and security in order on every cluster.
What got in the way Learning a backup gap or a vulnerable image only after it mattered.
03 · Thinking
A cluster has thousands of objects, so I designed for the question, not for the object model.
Rule 01
Answer first, tables second
Every page opens with what people came to know: is it healthy, what changed, what needs me. The full list sits below it.
Rule 02
Health in words
Running, Error, Not ready, Skipped: states are written out and coloured, so nobody decodes a number like 0/1 alone.
Rule 03
The next step on the row
Logs and a terminal sit on every pod, Rollback on every Helm revision, Restore on every database’s Backup page.
Rule 04
Every object, one click from its neighbours
Details, events, related resources and YAML share one side menu, so following a problem never means a new search.
04 · Overview
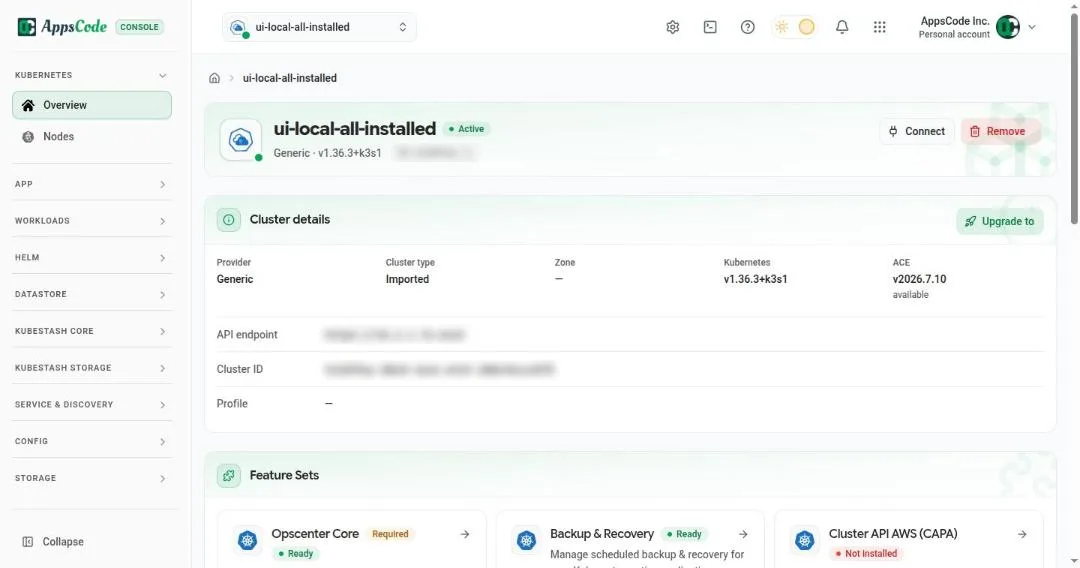
Opening a cluster answers “is it healthy, and what can I do next?” before anything else.
05 · Resources
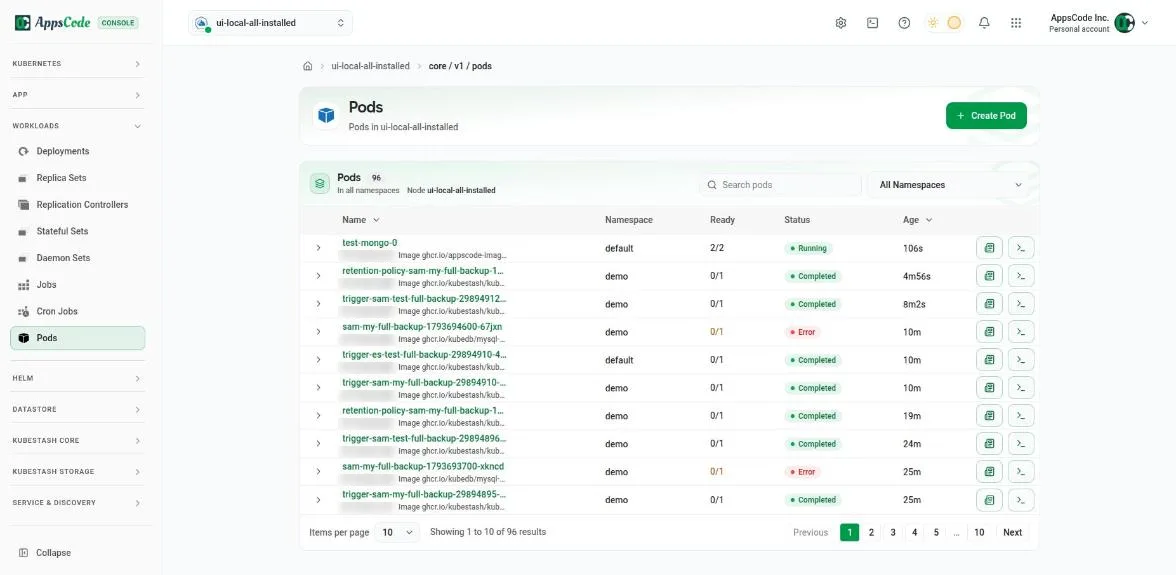
Every Kubernetes resource is browsable, but lists are built for finding the one that’s wrong.
- One pattern for every kind: a count, a search, a namespace picker, and a row that opens the details.
- A resource page keeps Overview, Events, Graph and Manifest in one side menu, so the cause is a click away.
- Create, Edit and Delete appear only where they make sense, for example never Create on Nodes.
06 · Connections
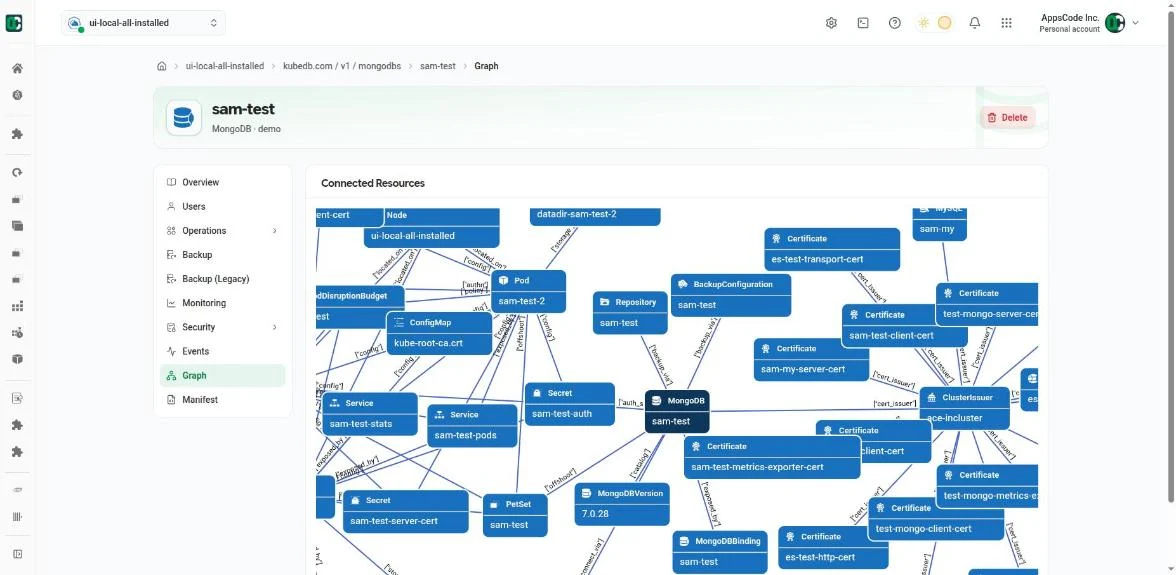
Kubernetes spreads one app across dozens of objects, so each resource draws its own map.
- The Graph tab shows everything linked to a resource: its pods, secrets, services, certificates and backups.
- Each node opens its own page, so tracing a broken certificate to the database it serves is one path, not five searches.
07 · Operations
Backups, monitoring, Helm and terminals live beside the resource they belong to, not in separate tools.
- A database’s Backup and Monitoring tabs show its own schedules, snapshots, service monitors and Prometheus, already linked.
- Repositories show integrity and the last successful backup, so a backup that won’t restore shows up before the day it’s needed.
- Helm releases list chart, version and status, and any earlier revision is one Rollback away.
- Security reports read vulnerabilities by cluster, namespace, image or CVE, and link each one to the workloads it affects.
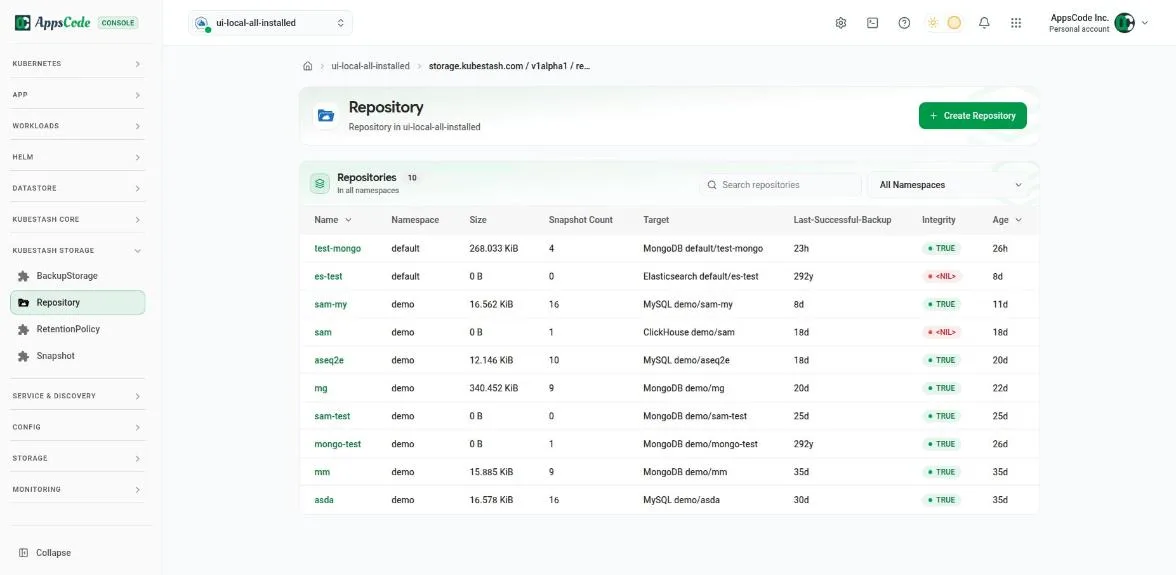
Backup repositories: size, snapshots, last successful backup and integrity, so a broken backup shows before it is needed 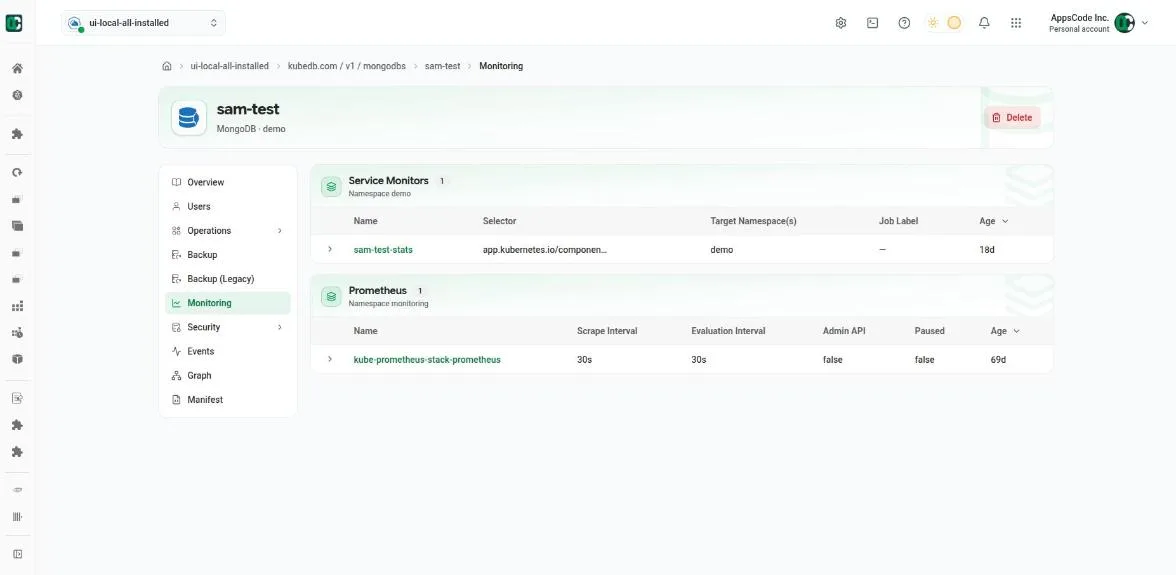
A database’s Monitoring tab: the service monitor and Prometheus that watch it, found for you 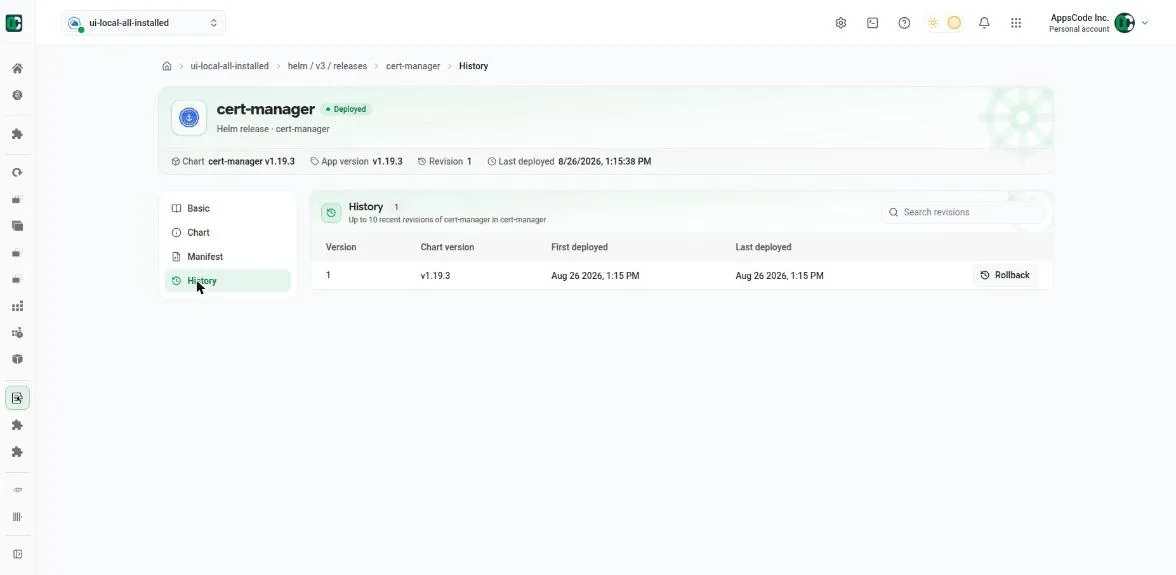
A Helm release’s history: chart, version and deploy time in the header, and Rollback on each revision 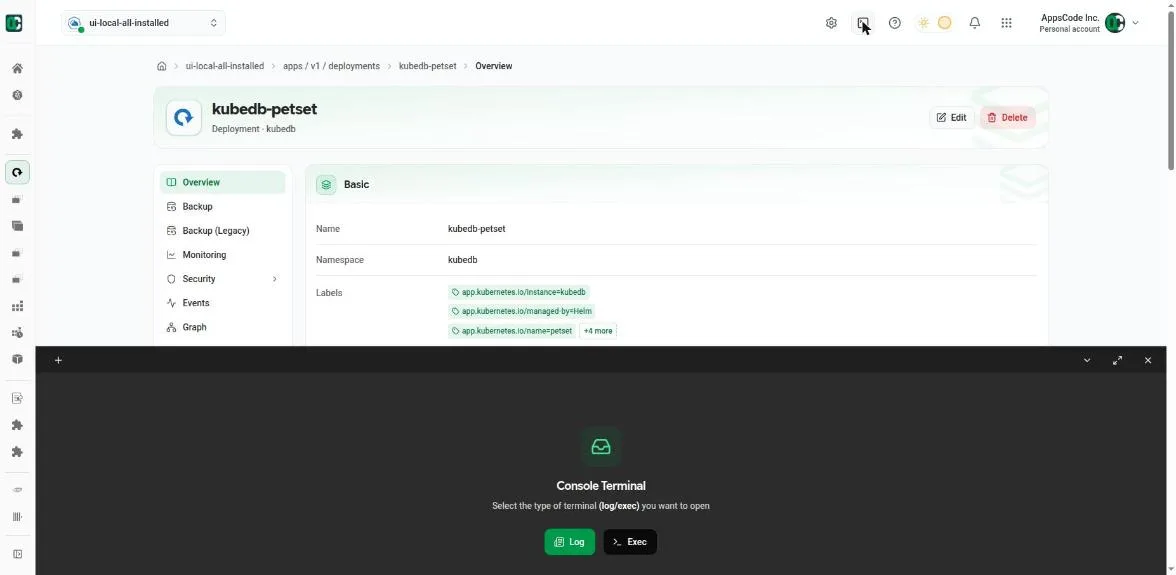
The console terminal opens over the page: pick Log or Exec, then a pod and container, with no kubeconfig on your machine
08 · Outcome
Day-to-day cluster work now happens in the browser, for everyone allowed to do it.
- From a failed pod to its logs or a shell is one click, with no kubeconfig or kubectl on anyone’s machine.
- Slow operations stream their steps as they run, so nobody waits in the dark to find out whether one worked.
- Every list, detail page and tab follows one pattern, so learning one resource teaches all of them.
- What I learned: in a cluster, the most useful screen isn’t the one with the most data. It’s the one that points to the thing that’s wrong.
From the person who managed this work
“Mohin is not only a talented UI/UX engineer, but also a team player and communicator. He used various tools and methods to conduct user research, create wireframes and prototypes, test usability, and implement feedback.”